Dashboard
- h.elholm
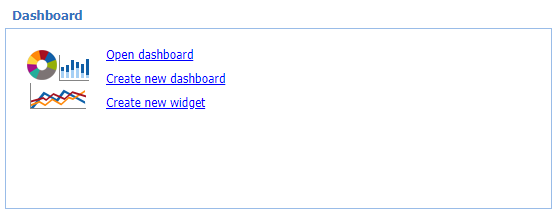
The dashboard is the central instrument and entry point for performing and managing statistical reports. Any number of dashboards can be created and equipped with so-called widgets. A dashboard widget represents a concrete statistic and can be updated automatically so that the open dashboard always shows a report with up-to-date data. The dashboards are always user-related, i.e. only the user who has created the dashboard can manage and access it. Open the dashboard window by clicking on the "open dashboard" link in the "dashboard" tile or by clicking on the "dashboard" tab on the right hand side of the Web Suite. Click on the arrow icon in the dashboard tab to maximize the window. Click the dashboard tab again to close the dashboard window.
Creating a new Dashboard
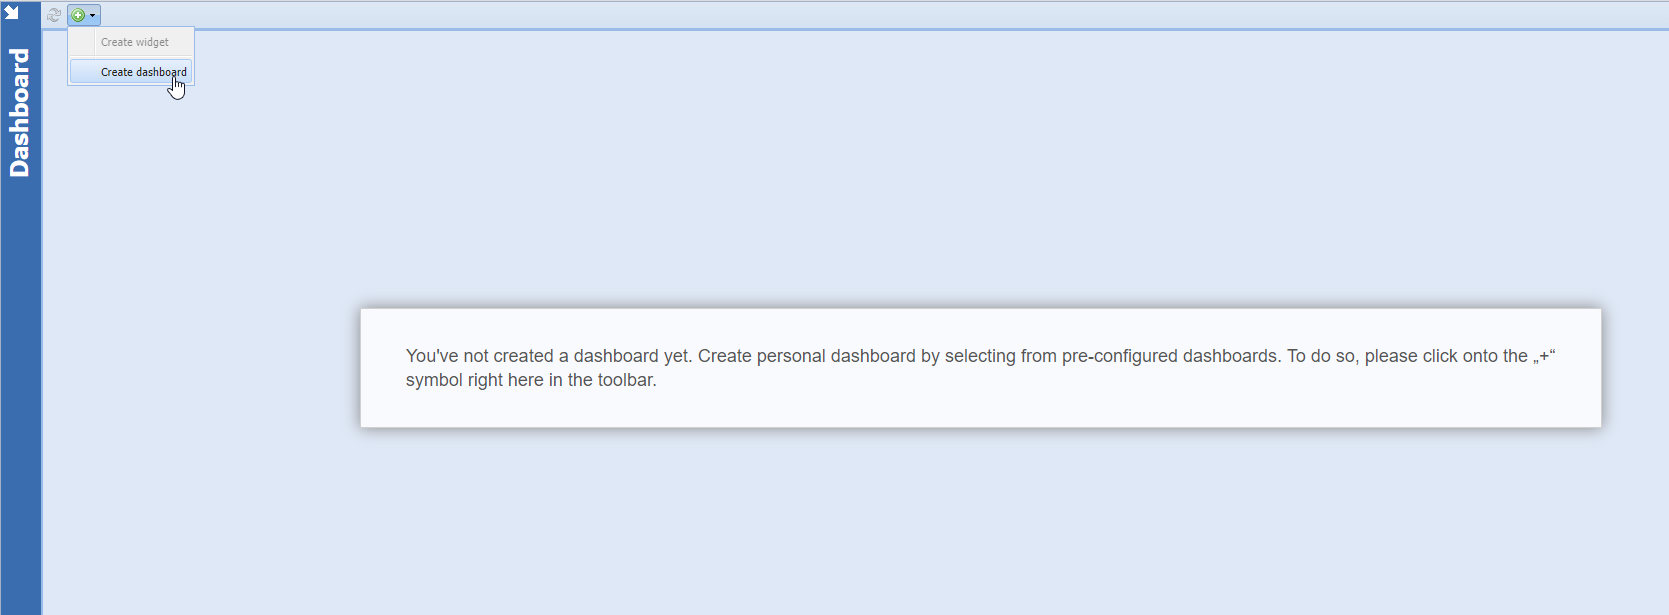
At first when logging in to the Web Suite the dashboard is empty (only for the so-called "standard user" a dashboard with standard analyses is already created during installation). To create a new dashboard please click on the "+" symbol in the dashboard toolbar and chose the entry "create dashboard".
A window will open with various predefined template dashboards on specific topics. Please select a template on the left hand side that fits your requirements, and you will see the widgets for the selected dashboard on the right hand side. For each widget there is a short explanation of the respective report below the diagram area. You can change the subtypes in the widgets and generally handle them as if they were widgets on your own dashboard. Even if you still within the template. Please note that the values displayed in the template dashboards are not based on your real data, but are only examples.
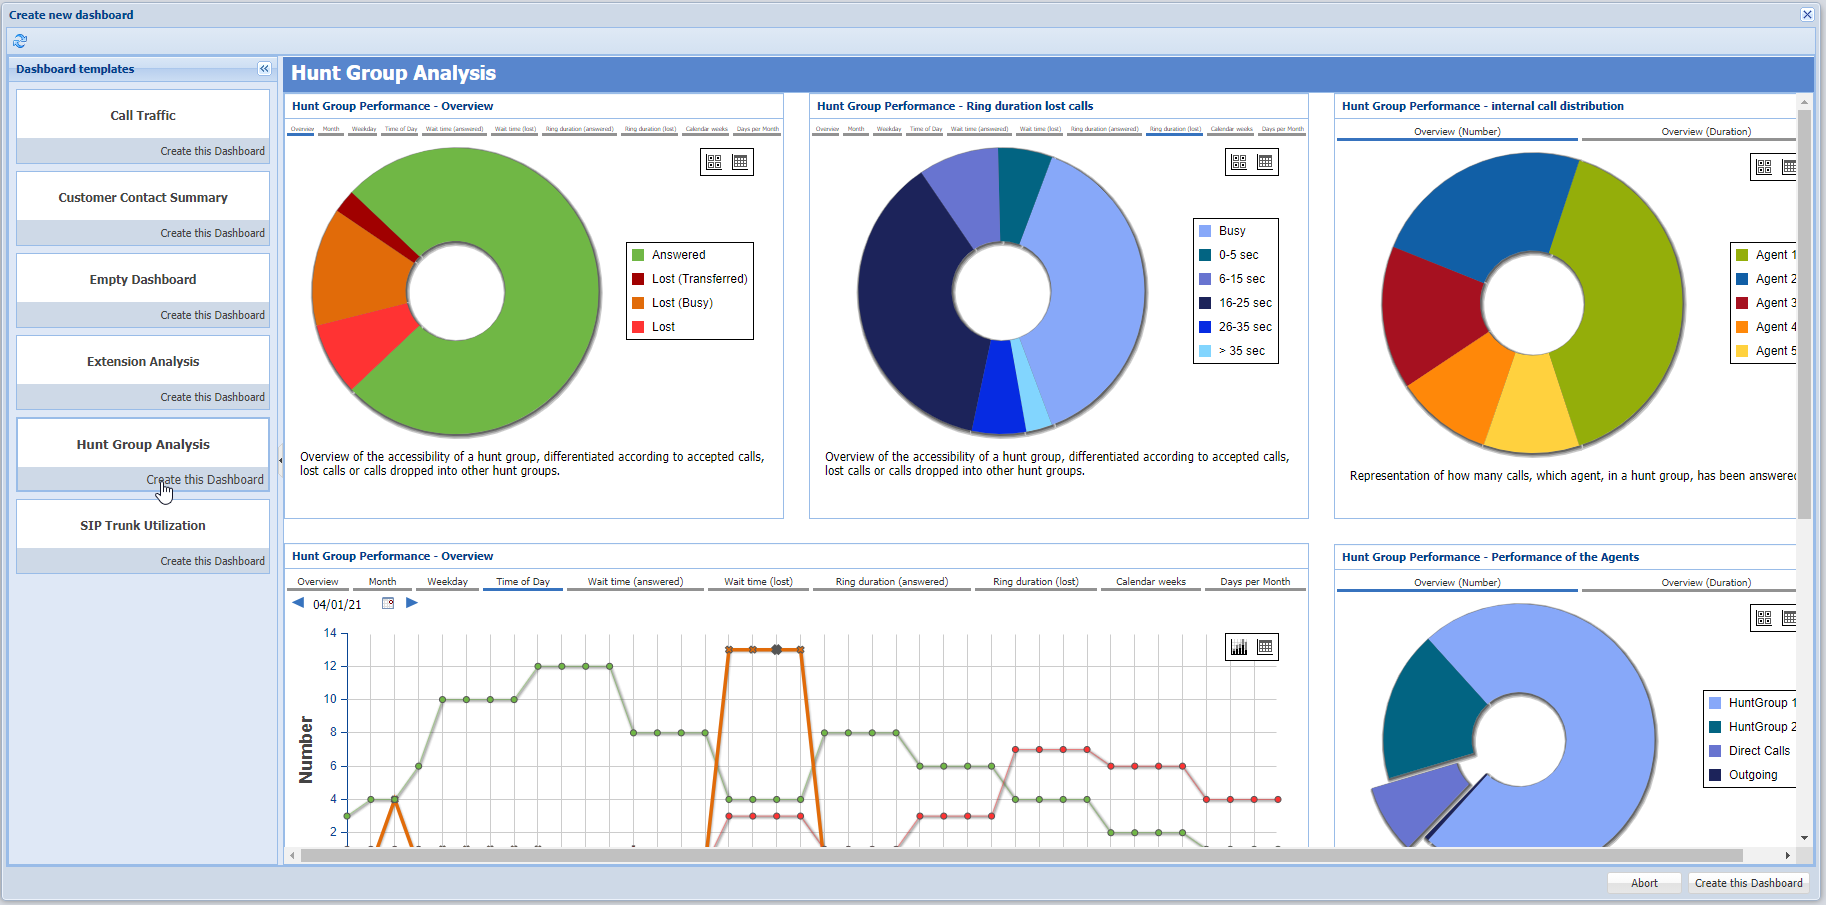
Once you have found a suitable dashboard template, click on "create this dashboard". This will create your personal copy of the dashboard and the dashboard is now listed on the left under "my dashboards".
Note: If your installation does not yet contain any or only a few call data, e.g. after a new installation, you can tick the box "use demo data" in the upper right corner and demo data for the widgets will be used. This makes the initial setup of the widgets much easier, because without data the charts would be empty and only after a certain period of time, when enough data have been recorded, one could see if the selected view of the chart is the desired one. Do not forget to untick the checkbox again so that you can evaluate real data after the setup.
Filter Options on Dashboard Level
You can configure all widgets on the dashboard together by opening up the configuration area at the top of the dashboard. Here you can change the time range, the hunt groups, subscribers, the PBX system etc. With "apply configuration to widgets" the settings are passed on to all widgets on this dashboard (the option "pass configuration to widgets" must be set on each tab). Please note that if widgets inherit the configuration from the dashboard, these settings cannot be changed in the widget itself.
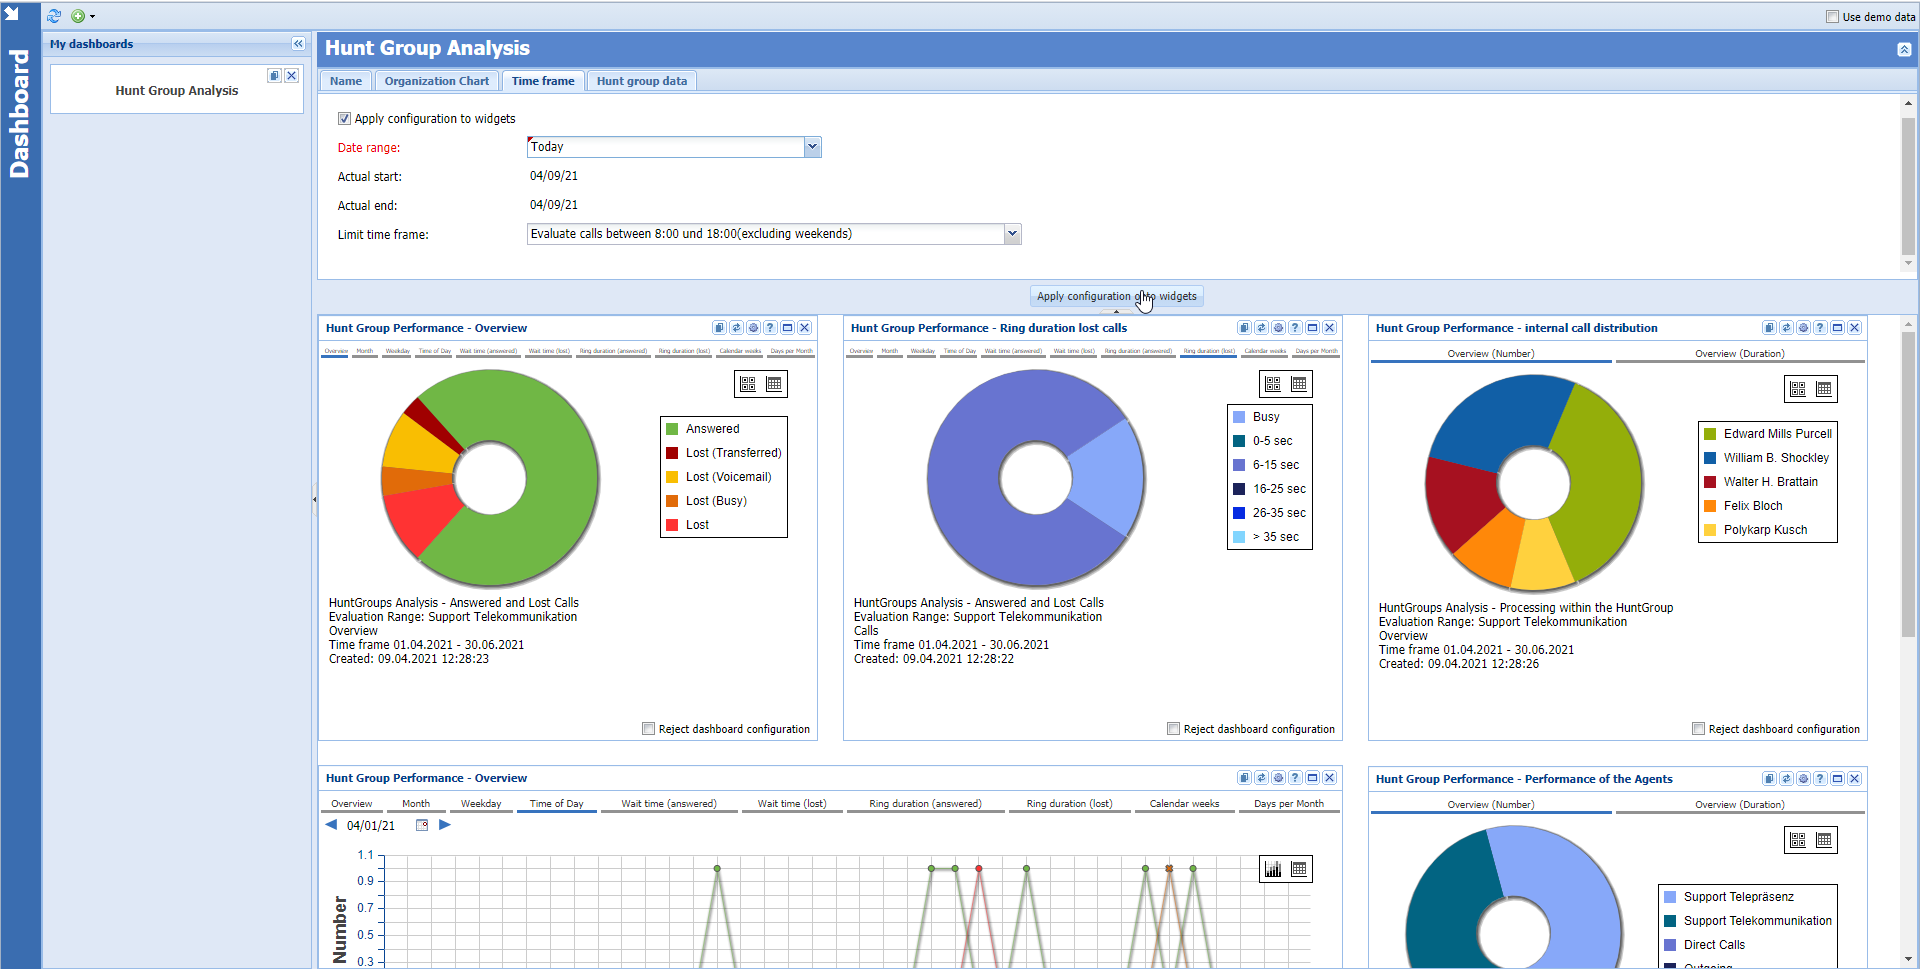
If there are widgets on your dashboard that should not inherit the dashboard settings, you can mark them with the option "do not apply dashboard configuration". This makes sense, for example, if you want to compare several hunt groups on one dashboard.
Adding new Widgets on the Dashboard
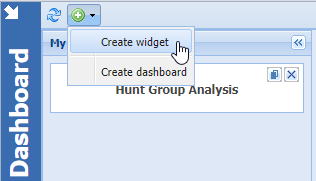
You can also fill your dashboards with individual widgets, independent of the pre-built template dashboards. To create individual widgets open your dashboard and click the "+" symbol in the toolbar, and then "create widget".
A window will open with all available widget options - all displayed as template widgets and grouped by theme. Select a theme that fits your requirements on the left hand side and you will get all widgets available for this theme on the right hand side. Below the diagram, each widget contains a short analysis description. Please note that the displayed values of the template dashboards are not based on real data, but on demo data.
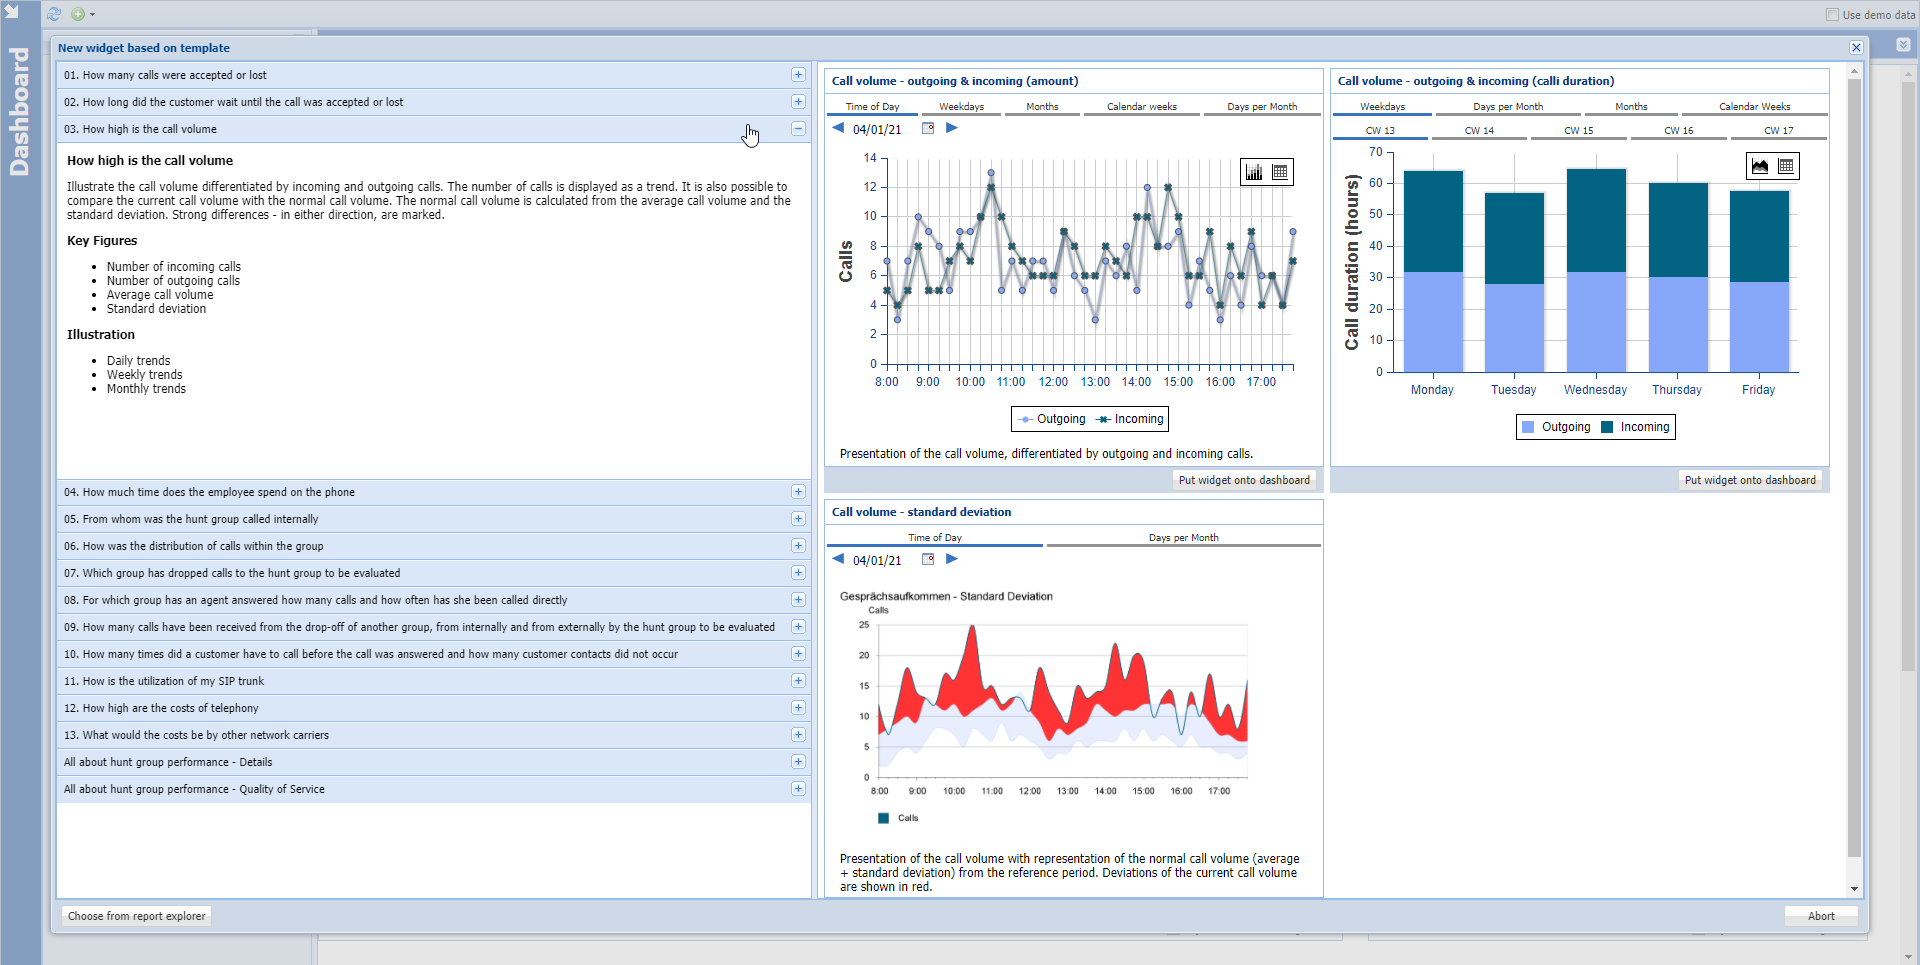
You can work the template widgets, as they were on your own dashboard i.e. you can change the subtype and the view or use the legend to show or hide individual lines/bars/segments. Once you have found the right widget and view, you can transfer it to your own dashboard by clicking "put widget on dashboard". A copy is created and placed on your dashboard.
Configuring Widgets
Each widget has a toolbar with the following buttons:
![]()
- Duplicate: Creates a copy of the widget
- Update: The evaluation is performed again and the view is updated.
- Settings: Here you can change the name of the widget, select the evaluated agents’ name, subtype and hunt group (if not done by the dashboard). If the widget should be updated automatically, the option "update widget automatically" must be set. Further configuration settings can be made via "Details".
- ?: The info text below the diagram is shown or hidden.
- Maximise: The widget is displayed full screen. Clicking on it resets the widget to its original size and position
- X: The widget is removed from the dashboard and deleted.
Related content
© aurenz GmbH 2022