Reporting and the Report Management
- h.elholm
Any types of reports can be created, managed and executed via the tile reports:
- Classic accounting reports for cost allocation
- Statistical reports regarding the measurement of accessibility, trunk utilisation and voice quality and
- Deletion rules for the automatic deletion of call data
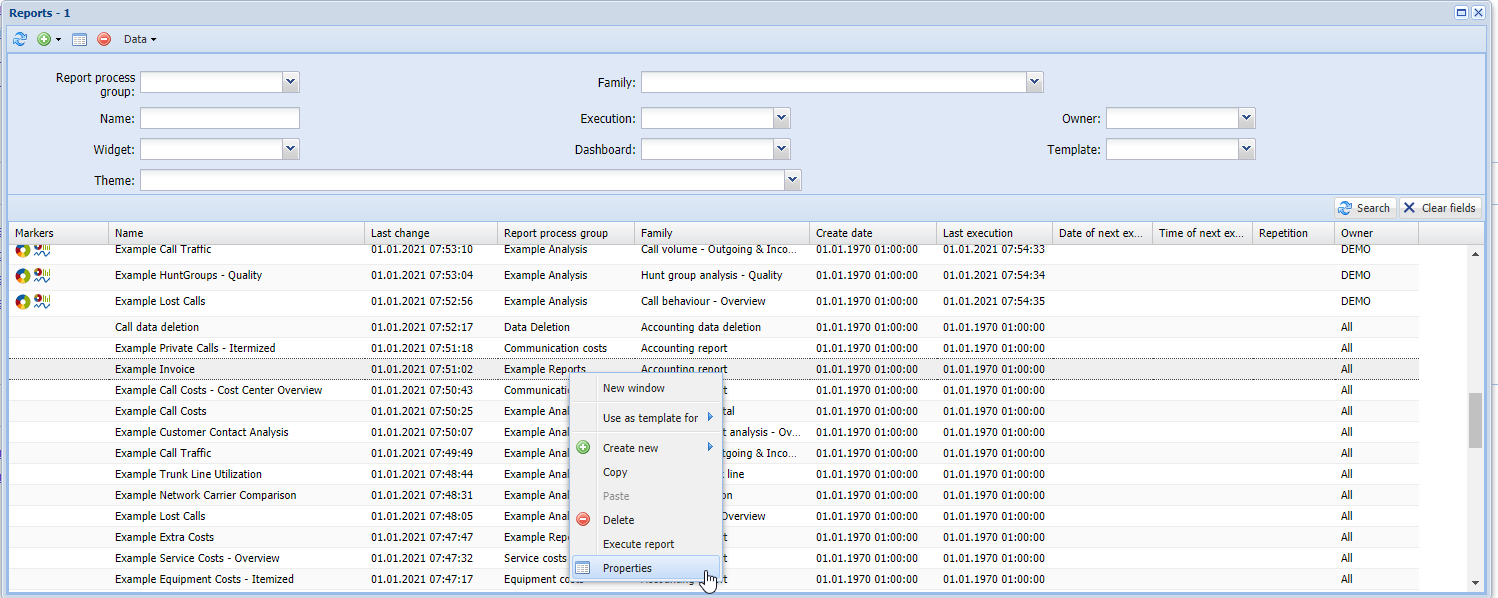
The report management view shows all reports in a list including information about the type, the owner, the creation date and the date of last modification. Using the context menu, you can open a report configuration and change its parameters, create a duplicate, use the report as a template for a new report, delete or execute the report.
The Possibilities to execute and automatically distribute Reports
A report can be executed in different ways.
- Directly from within the report management view via the context menu of an entry
- Directly from within the properties window of a report (see section "creating a new accounting report")
- Automatically via a report scheduler
- Statistics: via the dashboard
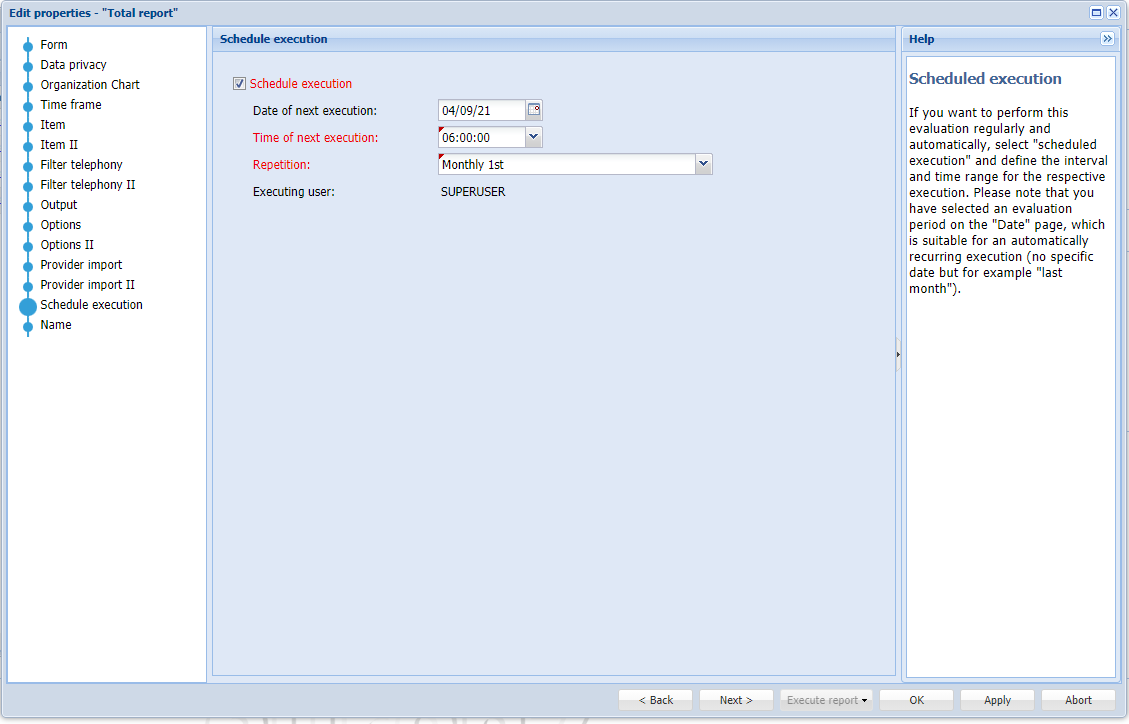
If you want a report to be executed automatically, you must first specify a time scheme in the report configuration on the "Schedule execution" property page. On the one hand, define when and in what time intervals the report is to be executed and, on the other hand, define the format for the output on the "Output" page. Both configuration options are described in detail in the following sections.
Once you have defined that a report is to be automatically distributed to various recipients, you must of course define on what way. Below different ways to do this:
- Sending the report by email (as attachment)
- Filing and provision for downloading the report in the recipient's personal Web Suite mailbox.
- Storing the report on the file system (not recommended. Data protection!)
Accounting Reports
The basic difference between accounting reports and statistical reports is that in the accounting reports, the data is always displayed in table form. The table columns, the header and footer areas and the layout of the report are determined by so-called forms, which are referenced when the report is configured. By the accounting reports the call charges and the call duration are essential, and a distinction is made between total reports and detailed reports. In the detailed reports, individual call data records and individual fields are issued, whereas in total reports, the call data records and their fields are only issued as “totals”. What the totals refer to must be specified in the report: there are sums per organisation chart level, per distance zone or per target number.
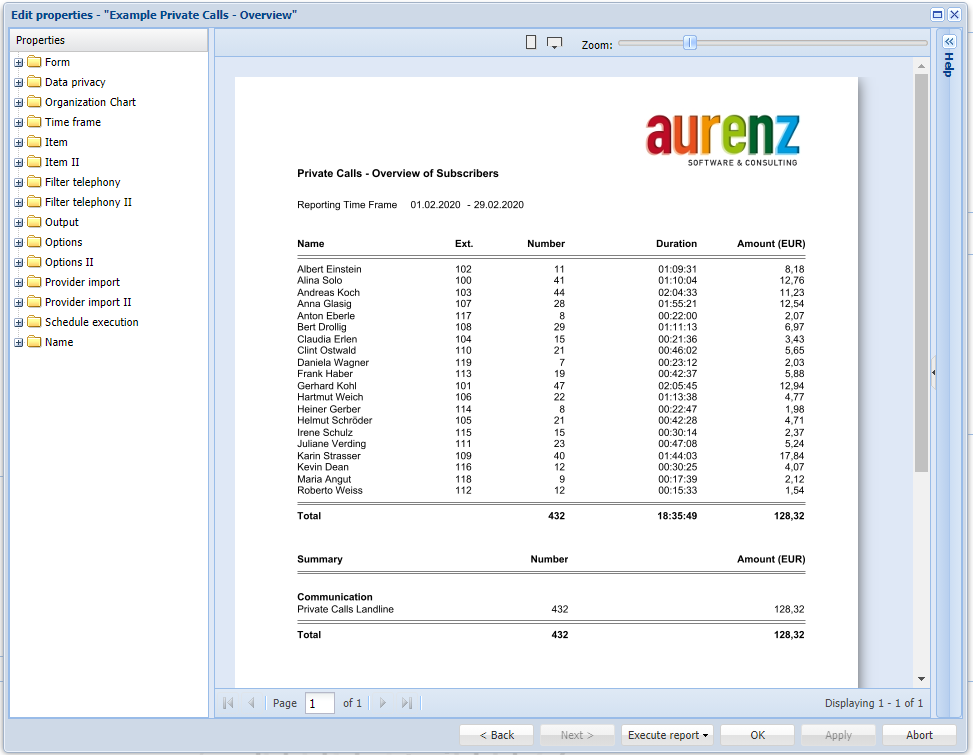
Example of a detailed report:
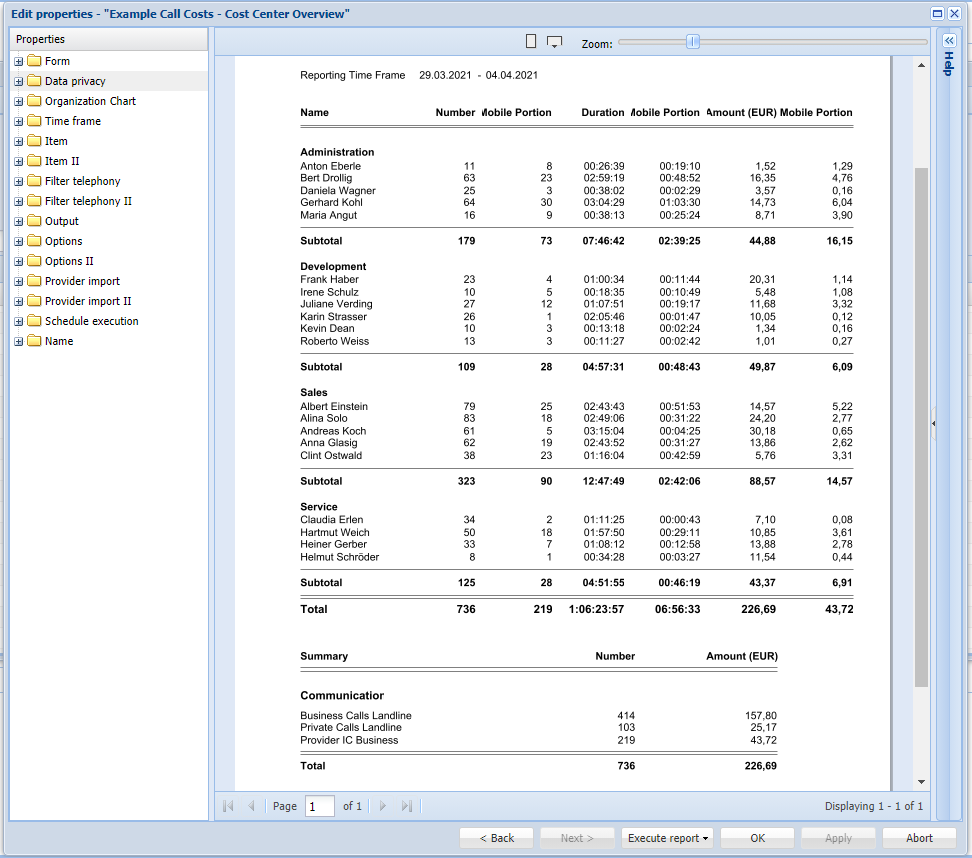
Example of a department level total report
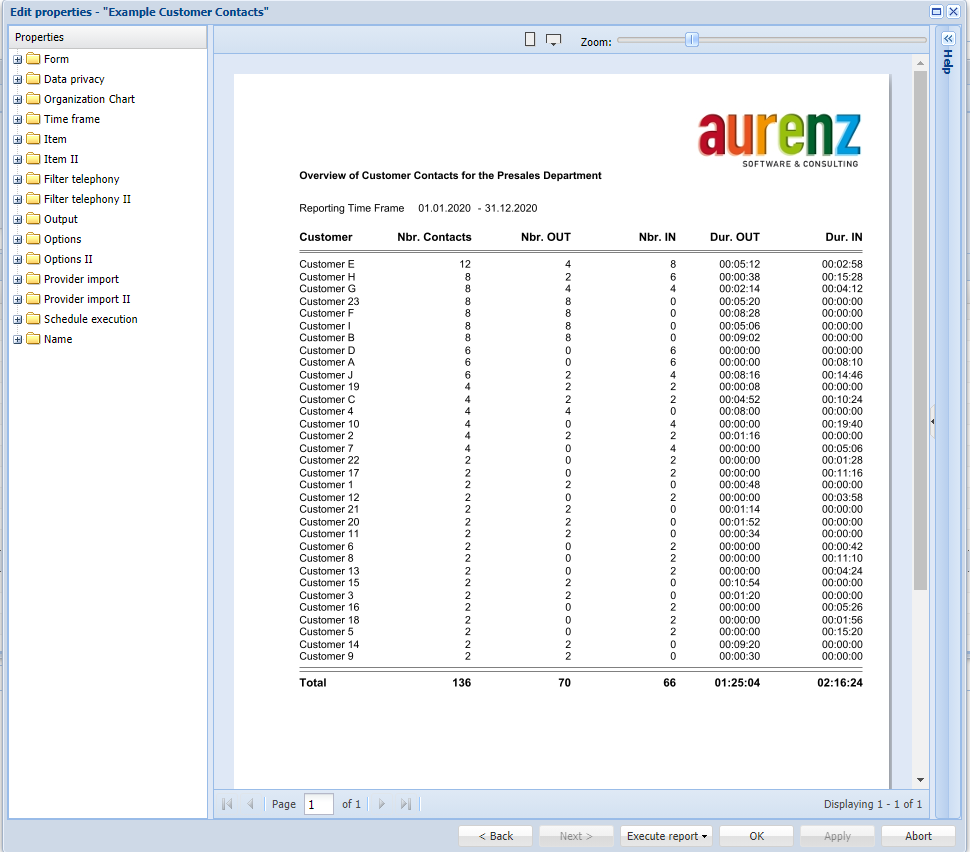
Total report based on target numbers (customer numbers)
Creating a new accounting-report
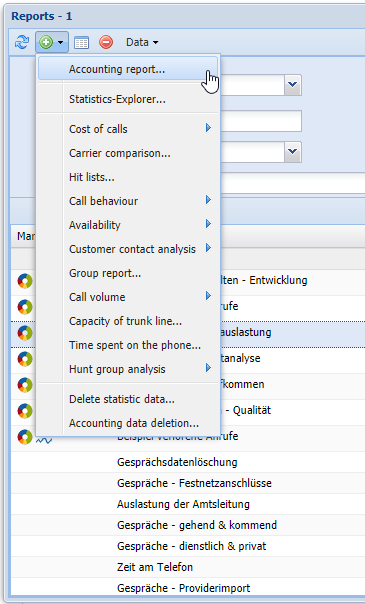
Go to the report management view and click on the "+" symbol in the toolbar, and then select "accounting report".
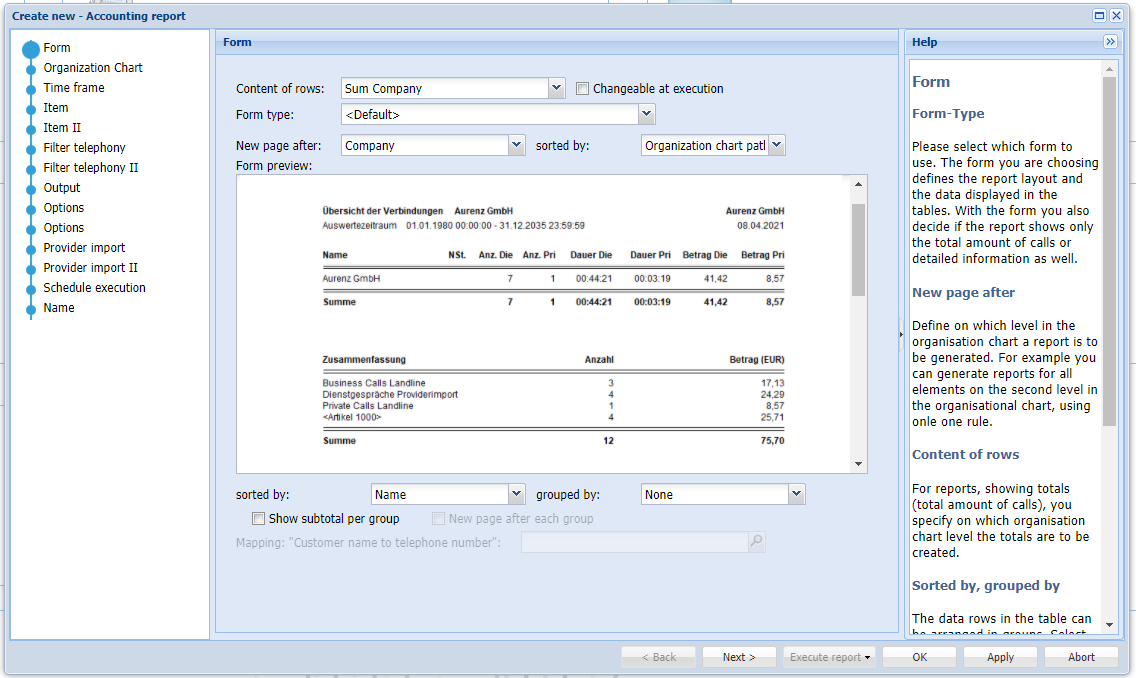
A wizard for the configuration of the new report will open. On the first page "Form", the field "contents of the lines" is used to define whether the report should be a total or detailed report. Have a look to the preview to see what the report will look like with the parameters defined on this page. The selected form is important here. The form is used to define both the table contents (column fields) and the layout (header and footer) of the report. The UC-Analytics is delivered including a number of ready-made forms. See if you can find a suitable form. If not, it is possible to modify an existing form or to create a new form from scratch. To do this, the Form Editor can be used in the administrator tool.
First of all, within the field "contents of the rows" choose whether it should be a total or a detailed report. For the total reports, you define the basis on which the total is to be calculated (organisational chart level, target number, distance zone):
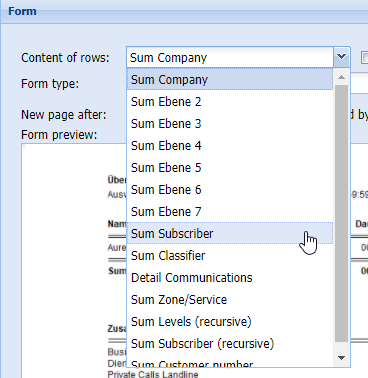
From "Sum Company" to "Sums Classifiers" the totals are based on the organisation chart levels. For instance, totals per department. By "Sums Zone/Service", the number of calls to the individual zones (city, near-distant, international ...) is added up. By "sums of customer numbers", a sum is calculated and displayed for each external customer telephone number. In order to form totals per customer number, the customer numbers and the customer names must be made known via an import file. If you have selected the option "sums of customer numbers ", you also specify the import file on this page.
File Format
The format of the import file is <customer name>; <customer phone number>. The customer telephone number does not have to be entered completely. For an assignment to a customer name it is enough if the phone number matches partial, starting from left, to the customer number. For example, the telephone number "+4970217388833" in the CDR would correspond to the customer number "+49702173888". However, the best match available is always selected for the phone number resolution.
After you have determined the report type in "contents of rows", please select a form that suits your requirements.
The forms cannot be changed via the Web Suite. If you do not find an appropriate form, change or create a new one using the administration tool.
Now go through the complete configuration of the report by paging to the next page with "next". In the help bar on the right side, each parameter and option is described thoroughly. Please look at the examples in the next section. Here each configuration step and parameters for specific examples are explained in detail.
When you have finished the configuration, you can save the report configuration with "accept" and then use the button "start execution/preview" to execute and view the report in the same window. Alternatively you can download the report as a PDF or CSV file. With "start execution/execute immediately" the report is issued in the output channel as defined on the "output" page.
The configuration wizard contains fewer configuration options than the properties dialog that appears when you re-open the report configuration. Normally, the configuration options of the wizard are sufficient.
Example 1: Itemized Bill of Business Calls for each Department (3rd Organisation Chart Level) to each Department by Email
Goal: to create one report that will be executed for all departments. The report should display single business calls with date/time, destination number, city name, duration and costs for each employee in the various departments. Every supervisor should receive the report concerning his/her department as PDF via email.
To create a new report, open the report management window and click on the "+" symbol on the left hand side in the toolbar and then select the entry "accounting report". The wizard for configuring the report will open.
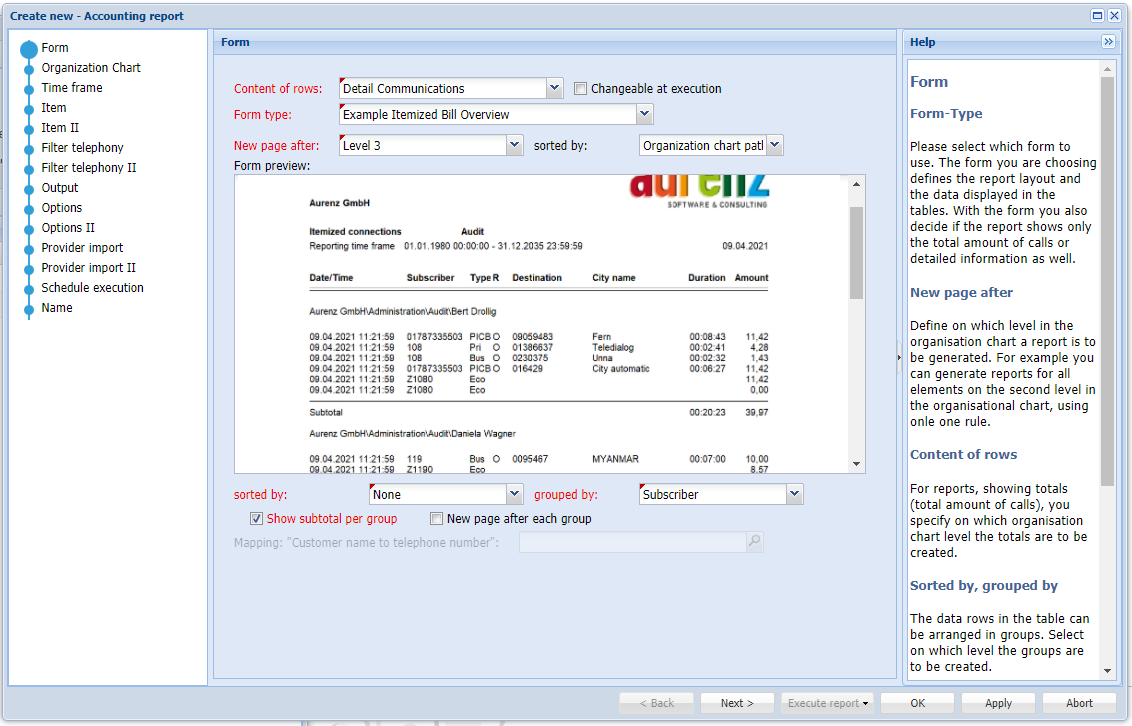
Page "Form": To obtain a report for itemized bills (shows every single call in detail), choose the entry "detail communication" in the field "contents of lines" on the first page. You can use the field "form type" to select the form for the report. You can see a corresponding preview of the selection in the form preview. Use the field "new page by" to specify on which organisational level the report should be summarised. The "recipient" of the report is defined at the same time. Since we want to generate a report for each department, select the organisational chart level "department" in the field "new page by". If you leave this field at "entire company", you will receive one report of all subscribers. The "group by" field allows you to select "subscribers" to specify that the call data for each subscriber is listed in blocks and the "subtotal per group" option displays a subtotal of the call charges and call duration for each block.
Leave the other fields like they are and continue with "next ".
The “change on execution" option
With the option "change by execution" it can be set that the settings on the displayed page may be changed if the report is executed via the Quick Start Bar. Background: There is a claim that only certain user groups (e.g. administrators) may create and configure reports. These reports are then released to the users via assignment to specific report groups. These users can run reports only through the quick start bar, they don't have access rights to open a report in the report management window. To prevent these users from having access to all configuration items, only certain configuration options can be enabled, such as changing the report period (date page).
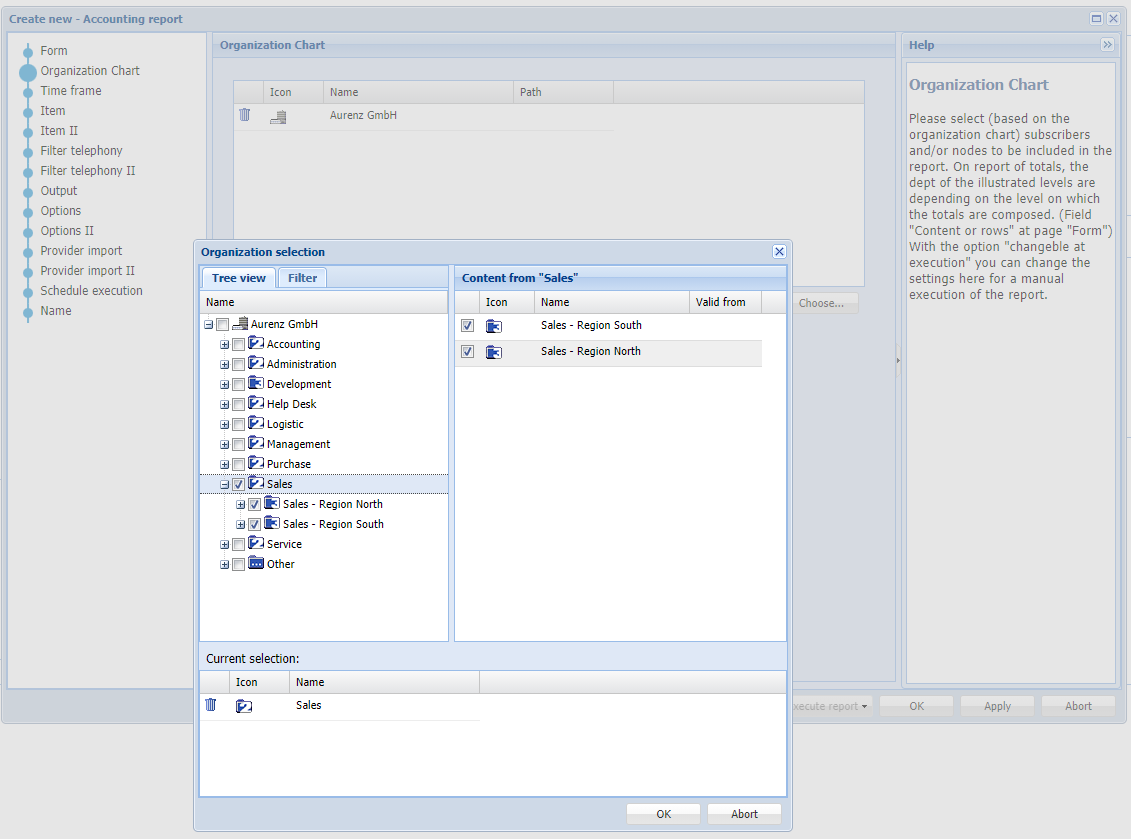
Page "Organisation Chart": next, select the departments to be included in the report. You can also select a superior level (here "sales"), all elements below this level will then automatically be included in the report. In the first page with the option “new page by” you have defined on which organisation chart level the report is to be carried out.
Page "Date": Select the date range here. If you want to run the report automatically and regularly by schedule, please select a generic date such as "last month".
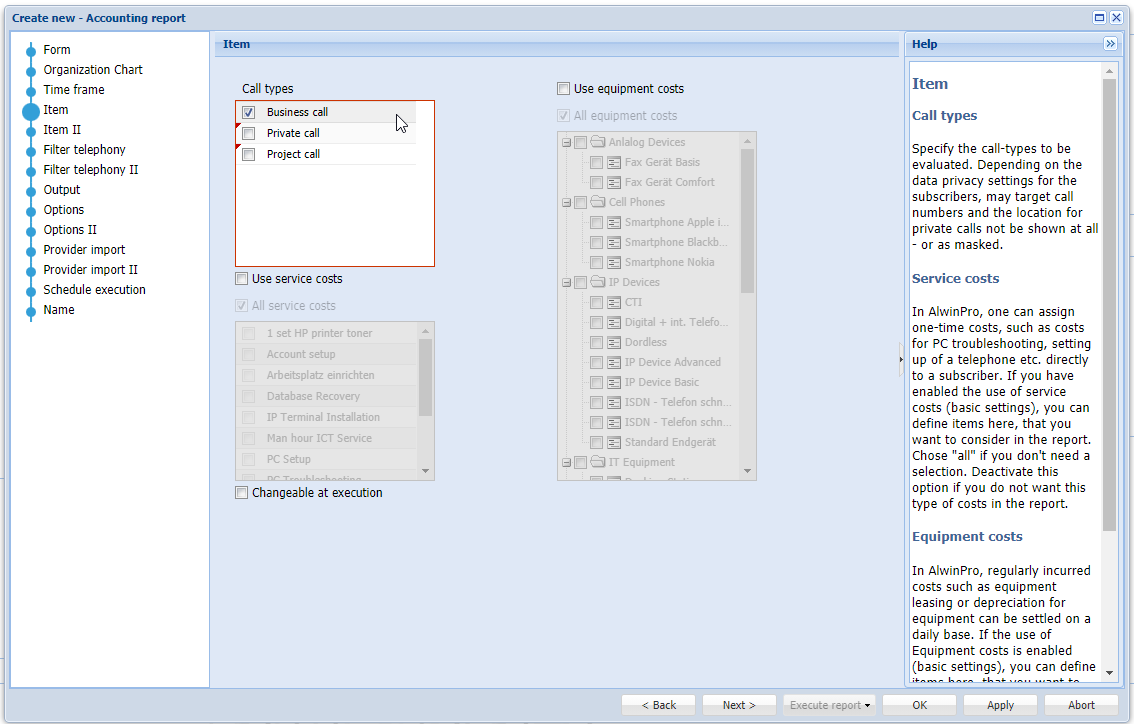
Page "Item": On the page "Item" you can define the call type you want to evaluate. Since we only want to see the business calls in this report, we only tick the box "business call". Equipment costs and service cost are not of interest here, so we don't activate these options.
Page "Item": Depending on your program configuration it might be that there is a page called "Item II". On this page you can define if call independent costs like basic fees should be considered in the report. In this example we don't need these settings
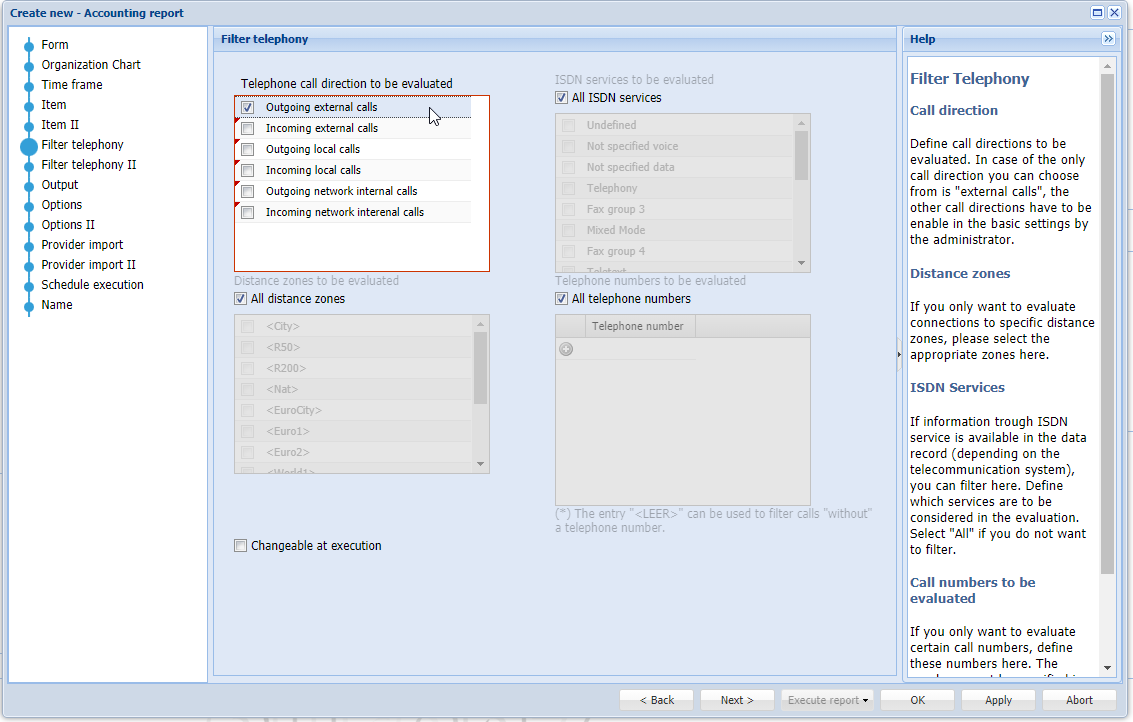
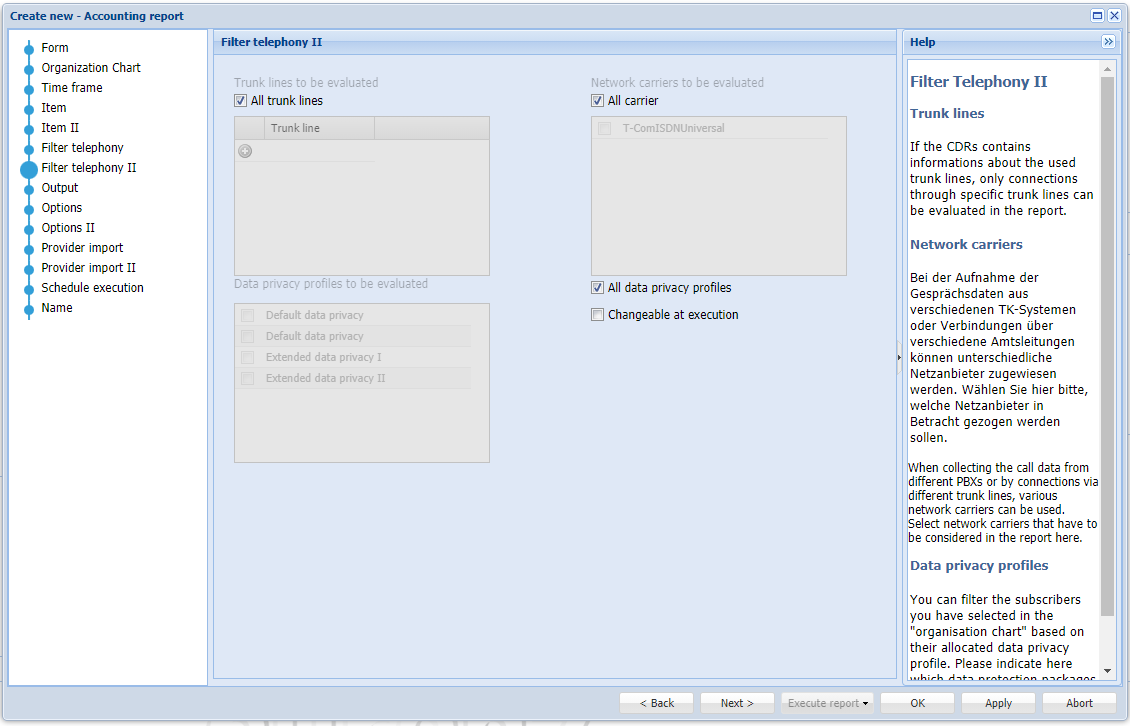
Page "Filter Telephony.": On these two pages you can define the call directions relevant for the report, the distance zones, which trunk lines the calls were made via, and the used network carrier tariff. Since we only want to look at the calls that cause costs, select the filter "external outgoing calls" and "all distance zones". You could use the distance zones to define a report that for instance only considers international calls. Leave the other filter options at their default values.
On the "Filter Telephony II" page you will find a selection of "call markers", if the use of "call markers" is enabled via the basic settings in the administration tool. A call marker can only be defined via the administration tool and is a filter for the total amount of data records. For example, one filter can be defined for calls that last longer than X seconds, and another filter for calls that are more expensive than X €. If several call markers are selected, then each one is applied individually for the total amount of data records. A combination of several call markers is thus considered an OR and not an AND of the individual filter conditions. If, in addition to the call marker filters, additional filter criteria have been defined on the page "options", the call markers filters are applied first and based on that dataset the criteria of the options page are applied.
In addition you can select filters based on trunk lines, used carrier and used data privacy profiles in this page.
These filter options are useful in certain special cases but in most cases not needed. This setting is therefore not displayed in the wizard when creating a new report, but only in the properties dialog of the report when opening the report via report management window.
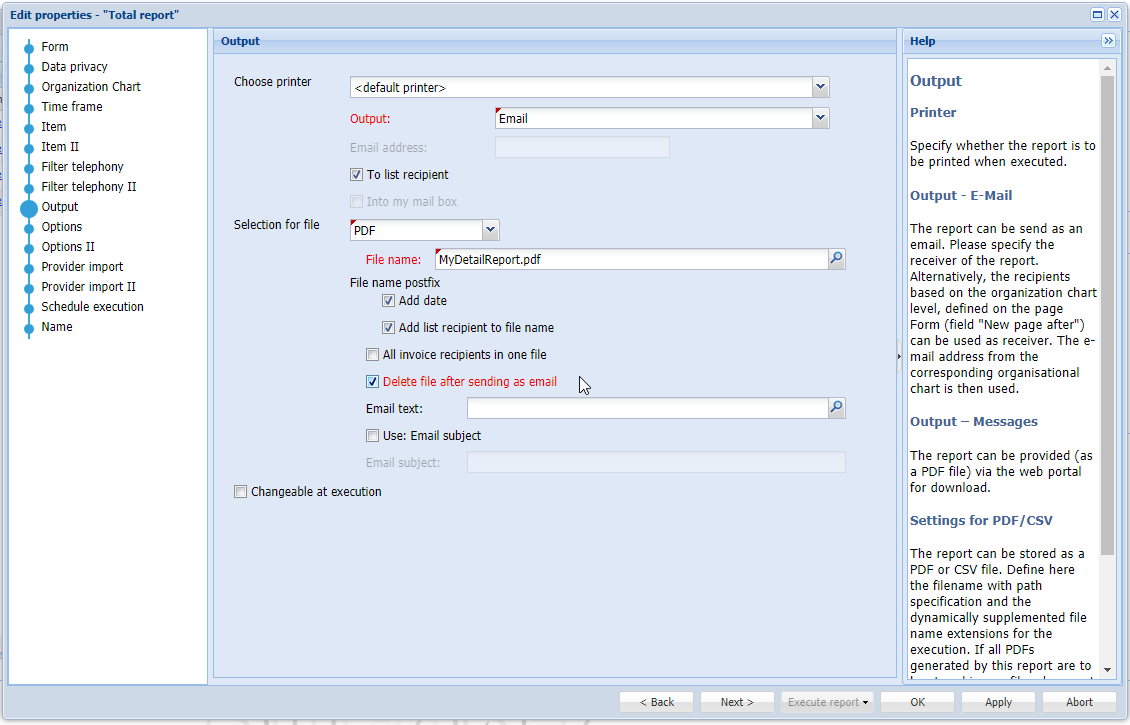
Page "Output": Here one can specify in which format the report result is to be generated, as a PDF or CSV file, and in which way the report is to be delivered. We want the report to be sent by email to each of the departments selected in the organisation chart. We do not want to create a separate report for each department, but the report should be generated automatically for each department (each department within the organisation chart selection) and sent to the respective supervisor. A report is generated for each department via one single report configuration. To achieve this on the page form we set the option new page on departments (level 2). You can now explicitly specify a recipient for the issue, who should receive the report, or you can set the option "to list recipient". If you choose this option, the report is sent to the e-mail address defined in the corresponding organisational chart element for which the report is to be created. Here it is the email address of the manager that is defined in the organisation chart elements of the departments (field "Email Address" in the property page of the organisation chart element of level 2). In this way, the reports can be sent automatically to the correct "invoice recipients". For the email body you could indicate a text file in the field "Email text", whose content would be used as email text in the body of the mail. If no email subject is selected, the name of the report will be used. With the option "All invoice recipients in one file" we could achieve that all reports would be generated in one file again. This option only makes sense if the report is going to one recipient.
Deletion of the Report Files
Note that the option "delete file after sending email" should be set, unless you want to keep the PDFs on the server for other purposes. If you do not set this option you have to ensure that the files will be deleted trough some other process.
Report Files are stored encrypted
The export/output file is stored encrypted on the server, under "RPCFiles" of UC-Analytics in the program directory. You can download or view them exclusively via the UC-Analytics file manager (if you have the necessary authorisation). This ensures that only persons with the appropriate user rights can open this files even if unauthorized persons have access to the file system of the UC-Analytics server (e.g. IT administrators).
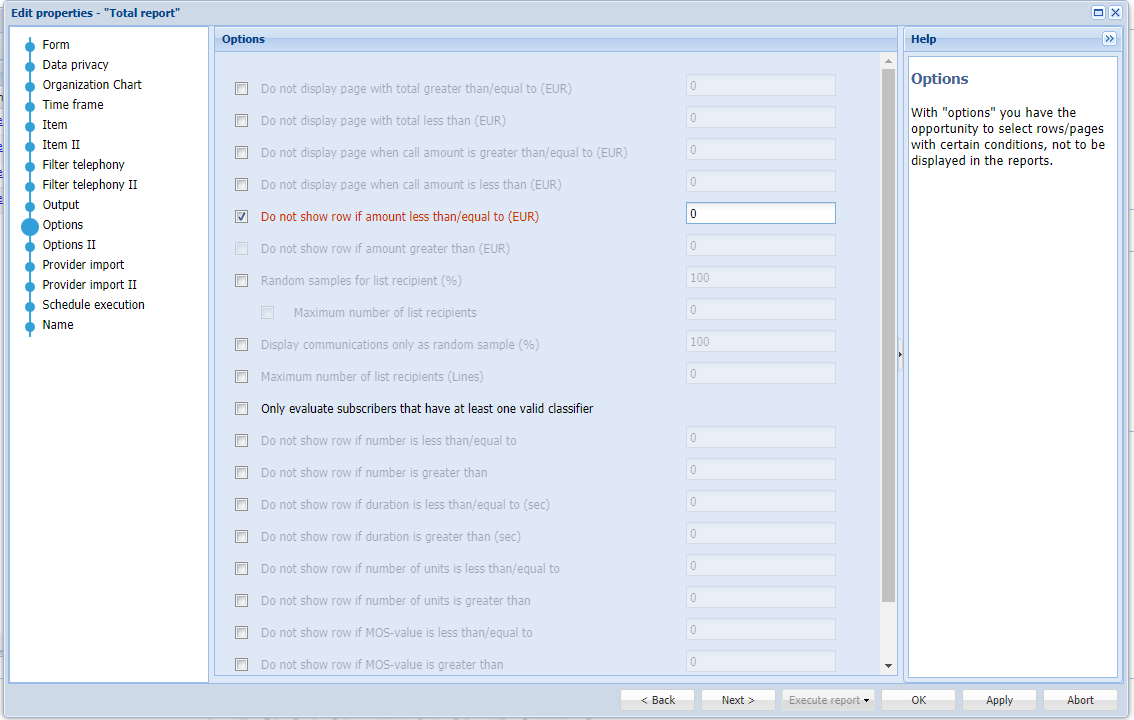
Page "Options": In options you can define certain conditions for individual lines – or entire pages – not to be issued or exclusively issued. We want our report to contain only lines that are relevant for cost allocation. Therefore we set the option "Do not issue line if amount is 0 or less". This ensures that calls that do not cost anything are not displayed.
Pages "Options II": Here you could define some special filter options based on the additional text attributes of the subscriber (e.g. include only subscribers for which the attribute "additional text #3" is equal to "basic tariff"). Another option is to filter the recipients of the reports by some subscriber attributes.
Pages "Provider Import": On that pages you can specify some filter options that are relevant if you have included data from imported invoices. Since this is not of interest here, we skip these settings. By default this kind of data is not considered in the report.
Page "Schedule": In order for the report to be executed automatically, we have to activate the option "execute automatically" on the page "Schedule" and define in which cycle the report should be executed and when the next execution should start.
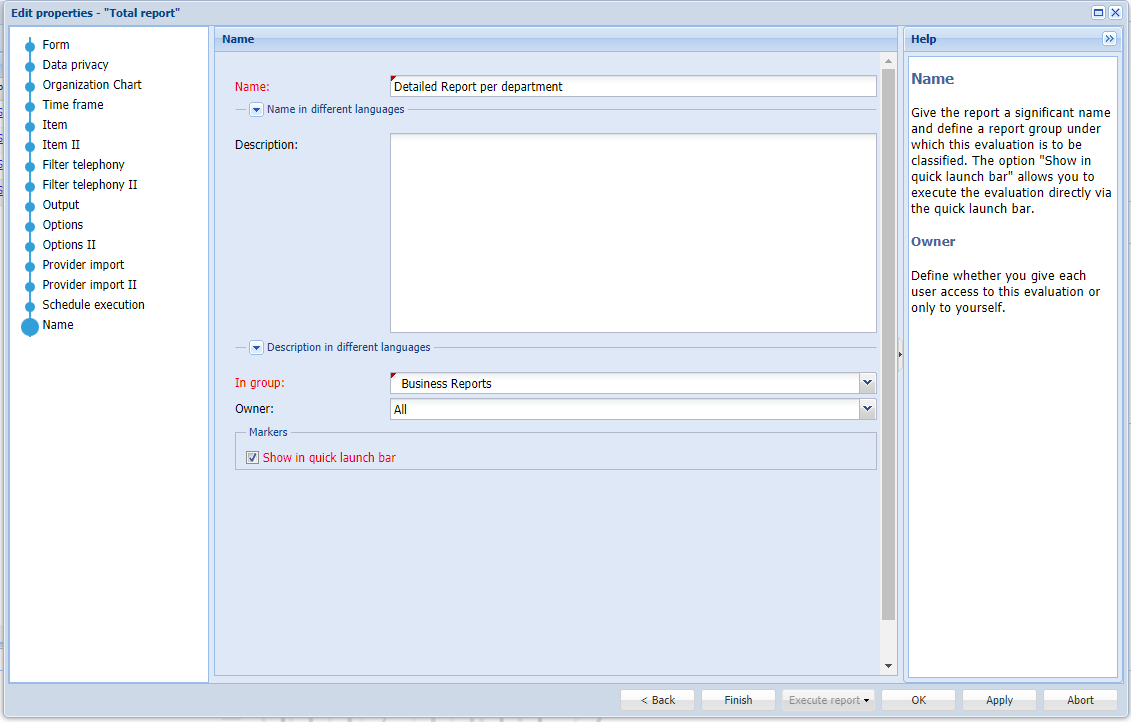
Page "Name": Last but not least, the report must be given a descriptive name (this is also used as email subject if no subject is explicitly is set). The field "owner" can be used to specify whether the report can be accessed by other UC-Analytics users or if it is only available for the user currently logged in. If the option "Show in Quick Launch Bar" is selected, the report appears in the quick launch bar under the corresponding group selected in the "in group" field.
Click "apply" to save the report. You can view the result as a preview by clicking the "Execute report" button and then "preview" - this will start the preview of the report which is displayed directly in this window.
If you want to change the configuration of the report afterwards, you can do this by going to "properties" in the report management via the context menu or by double-clicking the report in the list, to open the properties window directly.
The Properties Window contains more Options
If you open the properties window for a report, you will find additional configuration options. These options are necessary for special applications only, and are therefore not included in the wizard for creating new reports.
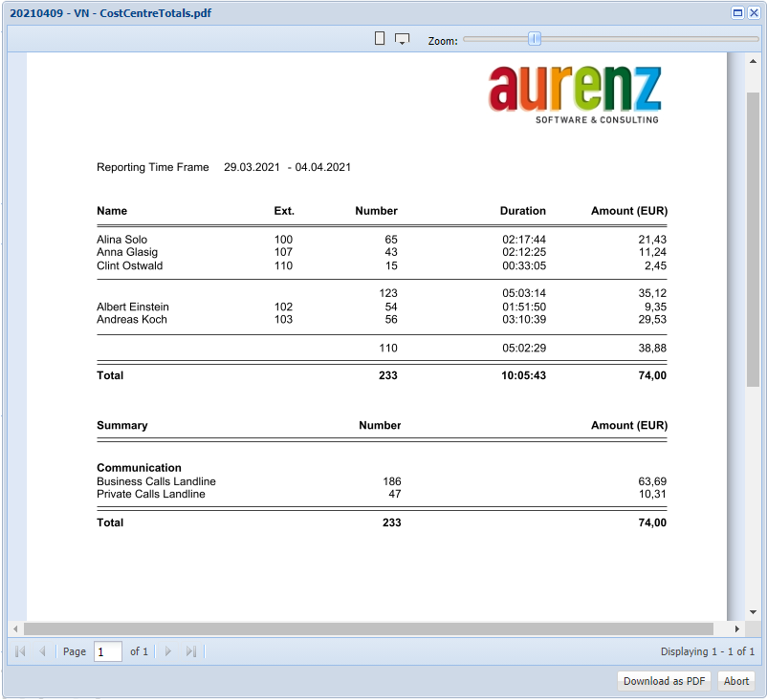
Example 2: Total of Business Calls for each Subscriber per Cost Centre (2nd Organisation Chart Level), made available via the Web Suite Mail Box
Goal: A report is to be created and executed for each cost centre which is on the 2nd level of the organisation chart. The report should display the business calls as a total (duration and amount) for each employee in the various cost centre. Every department manager should have the report for his/her department available to download via the Web Suite post box.
To create a new report, go to the report management and click on the "+" symbol in the top left corner of the toolbar and then select the entry "accounting report". The wizard for the report configuration will open.
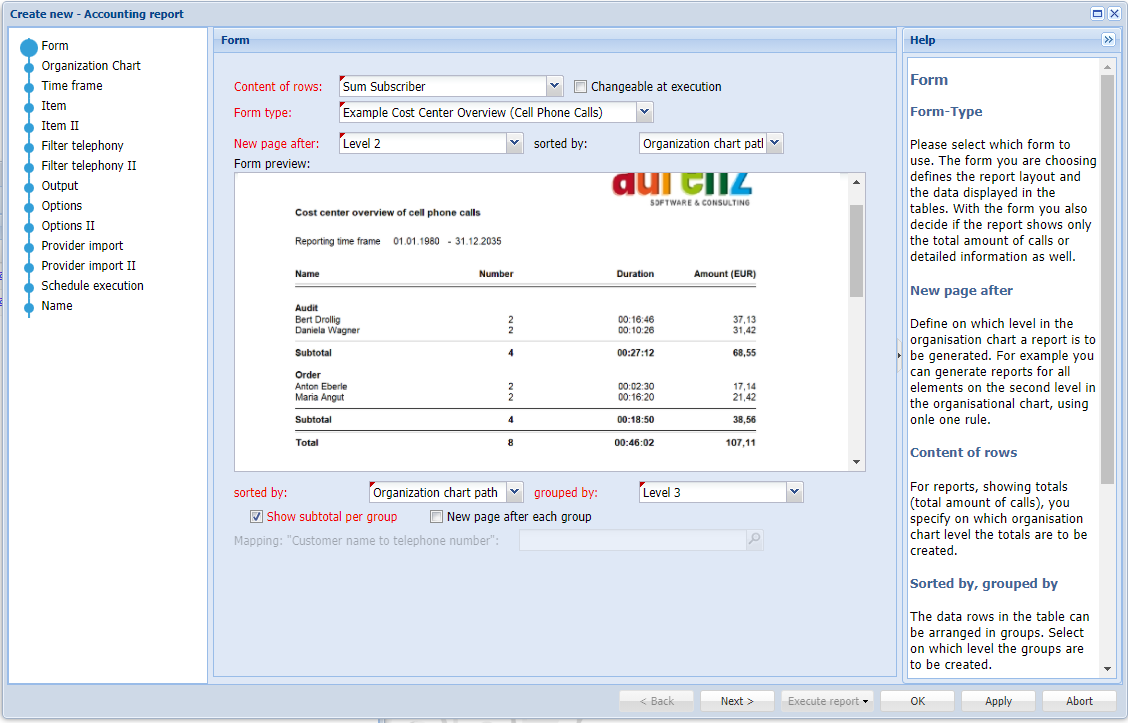
Page "Form": To get a report with totals per subscriber, select "Sum Subscriber" in the field "Content of rows" on the first page. You can use the field "form type" to select which form to be base for the report. You can see a corresponding preview of the selection in the form preview. Use the field "New page after" to specify the organisational level on which the report is to be summarised. The "recipient" of the report will also be defined with this setting. Since we want to generate a report for each cost centre, select the organisational chart level for the "cost centre", here Level 2 in the field "new page after". If you leave this field at "entire company", you would receive one report of all subscribers. In the field "group by" you use the Level 3 which is in our example the level where the departments are located. With this setting, all subscribers belonging to one department will be listed in the same group (block) within the report. With the "Show subtotal per group" option, a subtotal of the number of calls, call duration and costs are displayed for each group.
We leave the other fields as they are and continue with "Next >".
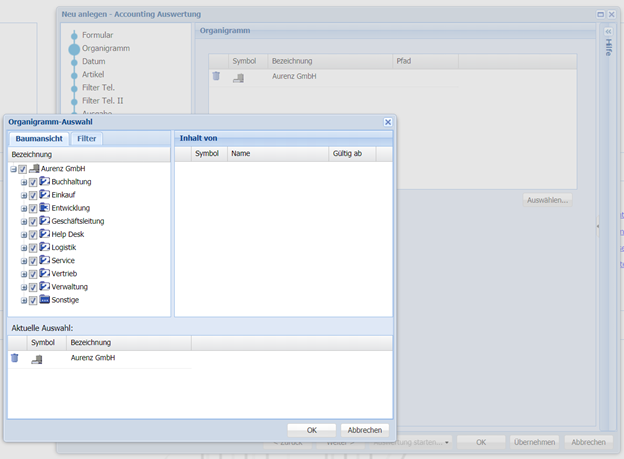
Page organisation chart: Select the top element on the "organisation chart" page to consider all cost centres (items on level 2) in the organisation chart. In the first dialog, using the field "New page after" you have defined which organisation chart level the report is based on.
The configuration of the page date, article, filter phone, options, execution plan and name corresponds to the configuration from the first example. Since we do not want to send this report by email, but to the Web Suite mail box of the respective users, we have to make the appropriate configuration on the output page:
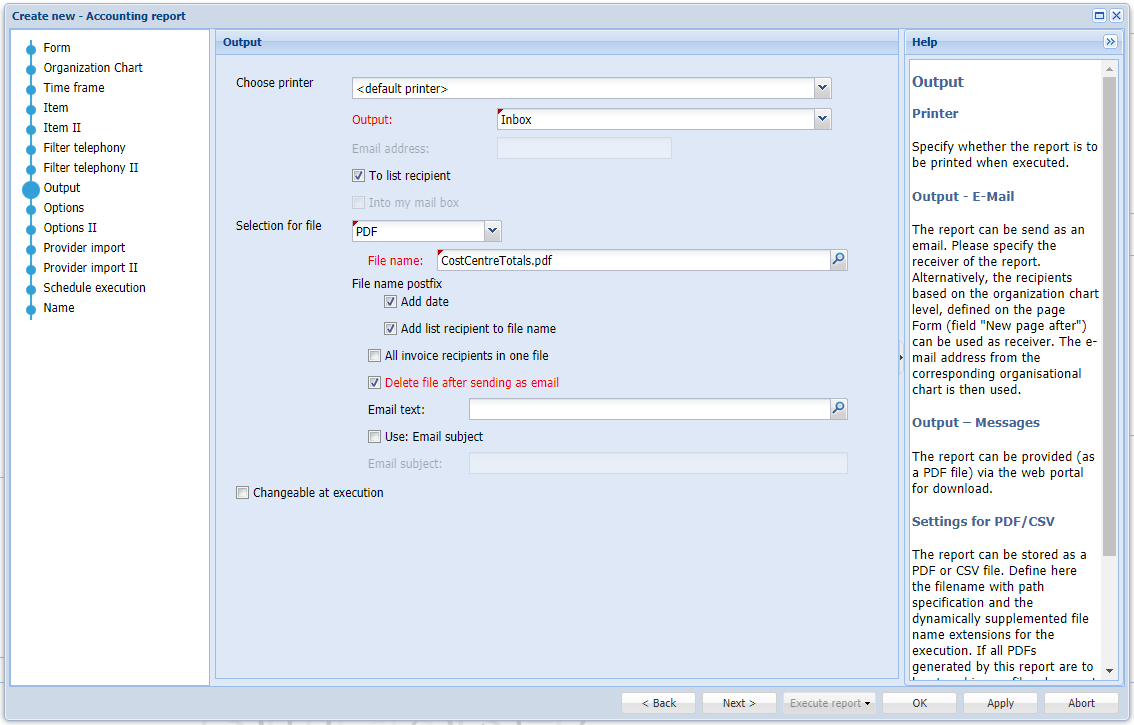
Page Output: On the "output" page, you can now specify the format (PDF or CSV file) in which the report is to be generated, and how the report is to be delivered. We want the report to be sent to the Web Suite mail box - to the cost centre manager - of each respective cost centre. However, we do not want to create a separate report for each cost centre. The report should be generated and send automatically to each cost centre manager (within the organisation chart selection). We have accomplished for one report to be generated for each cost centre via the report configuration. Here on the page “Form”, we set the “New page after” – option on Level 2 (cost centres). For the distribution of the reports, you can now explicitly specify one recipient for the output, or select the option "to list recipient". If this option is selected, the report is sent to the Web Suite mail box of the user with the corresponding email address defined in the organisation chart element for which the report is to be created. Here it is the email address of the person responsible for the cost centre whom is entered in the organisation chart elements of the level 2. This is how the reports can be sent to the corresponding "list recipients" automatically. For the email body you can specify a text file in the field "Email text". The text file content would then be used as text in the body of the message. The text file can be uploaded to the server by clicking the "browse" button in the field. A file selection dialog will then open for selecting a file already stored on the server. Via the context menu and the entry "new file" a locally stored file can be uploaded to the server and selected in the dialog.
Web Suite Users are identified through their Email Address
The UC-Analytics WebSuite user as recipient for the report is defined through it's email address. Even the report shall not be send by email one has to use the user's email address to define him/her as the recipient.
If no "email subject" is selected, the name of the report is used as title.
With the option "all invoice recipients in one file" we can achieve that all reports will be generated into one file again. The report would then be sent to the first recipient. This setting only makes sense if the report should be sent to one single recipient. Please note that the option "delete file after sending email" is set if you do not want to save the PDF on the server for other purposes.
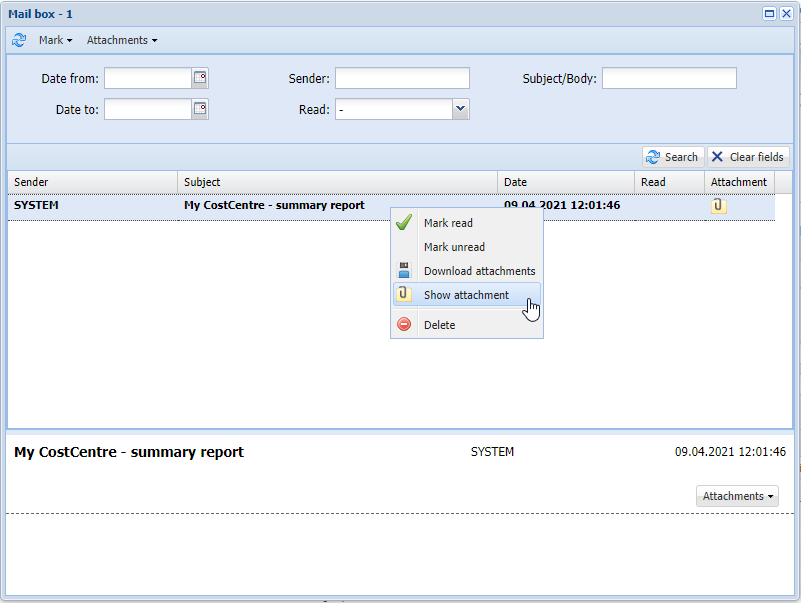
After executing the report, each cost centre manager receives a message in the mailbox with the respective PDF as an attachment:
Statistic Reports
Like the accounting reports, the statistical reports can also be created and managed using the report management view. In contrast to the accounting reports, where there are basically two types of reports, (summary and detailed) statistic reports have a number of different types and subtypes. It is not quite obvious behind which type or subtype the desired report can be found. Therefore it is recommended to create the statistics using the dashboard and its templates. Read the chapter "dashboard" for more information.
The Reporting Context
The program can be configured so that reports are always executed under a certain "context". There are three contexts under which a report can be carried out:
- The context "my data": In the organisation chart there is one subscriber holding the call data of a logged-in user. Only this subscriber can be evaluated under this context. For all other subscribers, no data is considered when the report is run.
- The context "my team": In the organisation chart there is one node (or more) that includes the team of logged-in users. Only these subscribers can be evaluated under this context. For all other subscribers, no data is considered when the report is run.
- The context "my company": These are all other subscribers in the registered user's company. Normally, the top node in the organisation chart.
The user role defines which statistics a user may execute under the respective contexts and which call types are considered in the accounting reports under the respective contexts. For example, it is possible that a user may only evaluate private calls under the context "my data". Or a user may execute the report of type "time on the telephone" in the context "my data" and "my team", but not in context "my company". If you issue an report under a context under which you have no rights, the report will be empty, i.e. it contains no data. However, it is still possible to execute the report. The resolution of which organisation chart areas stand for the context "my data", "my team" and "my company" is defined in the user settings. Either explicitly by manually assigning the organisation chart areas to the respective contexts in the user settings or by entering the user ID (usually the email address) in the corresponding property field of the organisation chart element. In the basic settings, it is defined which identifier and which field to use.
This mechanism allows you to create and configure a report, which can be used by all users. However, the data contained in the report is always context-related to the user executing the report.
The use of contexts is normally not activated.
Related content
© aurenz GmbH 2022